
The views, thoughts, and opinions expressed in the article belong solely to the author.
OCT has become an indispensable tool for evaluating eyes of patients with suspected glaucoma. However, there are several sources of error that may lead to misinterpretation of images, either by the platform technology or by the operator/clinician.
One user-specific source of error is in selecting the wrong map or in failing to review a complete set of information. In my practice, in which I use the swept-source OCT (SS-OCT) DRI OCT Triton (Topcon, Figure 1), I look at both the thickness map and the SuperPixel map (deviation map from the normative database) for peripapillary and macular scans. Retina nerve fiber layer (RNFL) or ganglion cell layer defects located in the typical glaucoma-vulnerability region are important findings for any glaucoma diagnosis. Both peripapillary and macular parameters are reviewed, as they are complementary in establishing a diagnosis. In cases of suspected glaucoma in the optic nerve head, evaluation of peripapillary RNFL thickness, including the average RNFL thickness, RNFL thickness map, and deviation map, is very important. In addition to that, evaluation of the macular ganglion cell layer in order to rule out suspect cases is important, as well.
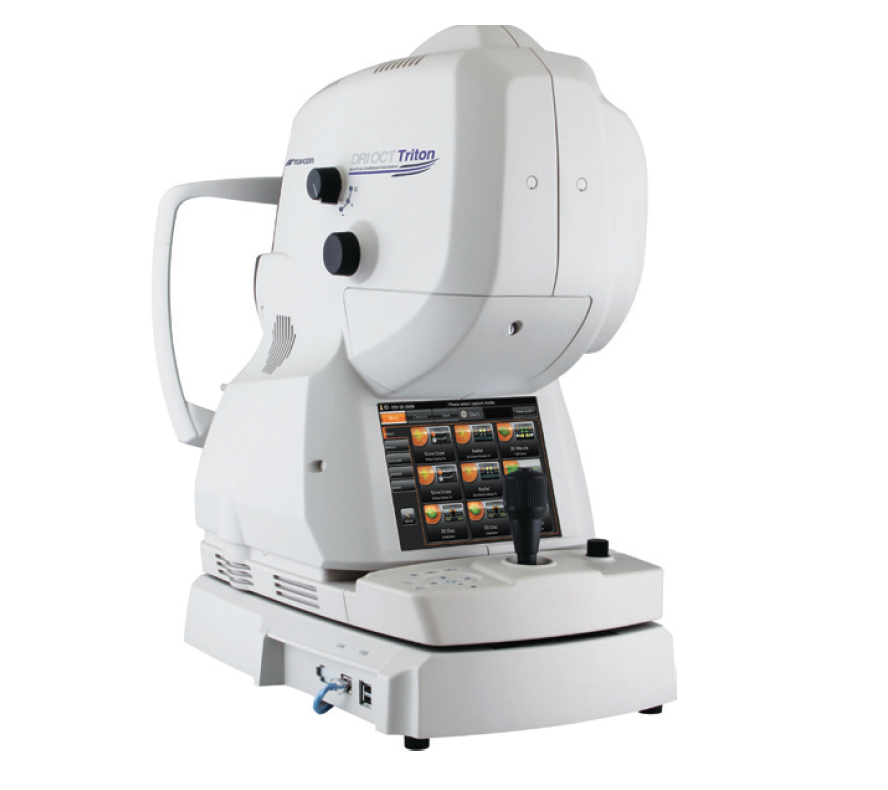
Figure 1. The SS-OCT DRI OCT Triton.
In all cases, it is important to confirm that the scan quality score is sufficient for interpreting an image. Scan quality, or signal strength, is generally understood to be the averaged intensity of the signal pixels in the OCT image. Correspondingly, image defocus may artificially depict thinning of the RNFL.1 In this respect, the DRI OCT Triton, which uses laser lighting as opposed to halogen lighting, may be advantageous in clinical practice. SS-OCT employs a narrow bandwidth laser that rapidly sweeps over a broad range of wavelength, thereby producing less light scatter and yielding high-quality images that are less prone to glare.
In the following, other common sources of OCT misinterpretation are reviewed, with a particular emphasis on how swept-source technology improves the ability to diagnose glaucoma compared to spectral-domain (SD-OCT) technology.
OCT Artifacts
Segmentation errors are a common reason for misinterpretation of OCT images. The introduction of spectral-domain technology has reduced the incidence of segmentation errors compared to time-domain; however, the former is still associated with potential to inaccurately depict RNFL thickness. Several risk factors have been identified, including decreasing RNFL thickness, decreasing scan quality, and increasing age.2 In the latter study, automated segmentation was found to result in thinner RNFL measurement compared to manual refinement. Thus, it is important to review OCT images, specifically noting the boundaries of the RNFL, and make corrections as necessary. The need to do so is especially relevant in eyes with epiretinal membrane, long axial length, poor visual acuity, cataract, and advanced glaucoma. In addition, OCT devices designed with faster scan speeds may help to overcome segmentation errors that result from poor signal strength, while use of longer wavelength light sources are less prone to errors due to media opacities.
Software features on some OCT devices that account for eye movement during scanning help to minimize misinterpretation due to motion artifacts. Subtle eye movements or blinks can lead to misalignment of the image, which may ultimately result in errors on RNFL thickness measurement. Eye tracking with registration to the iris or blood vessels on some SD-OCT platforms may help to improve reproducibility of RNFL measurements. SS-OCT accounts for this issue in a different manner. With respect to the DRI OCT Triton, the platform is equipped with the Active Eye Tracking feature for use during angiography; more importantly, though, the device is capable of 100,000 A-scans/sec—more than double that of SD-OCT—which reduces the impact of microsaccades.
Another source of OCT image misinterpretation fits more so into the category of patient-specific characteristics while also representing a known limitation in imaging technology. Media opacities, such as cataracts, have been shown to affect RNFL thickness measurement. Mwanza and colleagues reported that removal of a cataract increased signal strength by 24.1% and RNFL thickness measurement by 9.3% postoperatively, indicating that suggested glaucomatous progression on OCT may be an artifact of an advancing cataract.3 In cases of early-to-moderate cataract, OCT seems to be better than photography. However, in severe cataract, image quality might not be good enough. It should be noted that because SS-OCT uses a longer wavelength light source compared to SD-OCT, it is less prone to deflection by ocular opacities, including cataracts. Whether this is meaningful in severe cataracts is not entirely clear; however, this aspect of SS-OCT suggests a benefit relative to SD-OCT in early-to-moderate cortical and posterior subcapsular cataracts.
As noted above, there is growing recognition regarding the importance of gathering data beyond the peripapillary and/or macular area. In this respect, SS-OCT has the great advantages of faster scanning speed and wider-area scan coverage compared to SD-OCT.
To see the first insert in this series from Topcon, “SS-OCT: Clinical Applications for Diagnosing and Following Ocular Pathology,” go to bit.ly/ssoctretinatoday
Highly Myopic Eyes
A specific category of patients, those with long axial length, bears mentioning with respect to misinterpretation errors in the context of diagnosing glaucoma. Eyes with high myopia present a unique assessment challenge for glaucoma, as elongated axial length is a risk factor for deformation of the optic nerve head and the peripapillary region. Indeed, studies show an association between lamina cribrosa defect and associated acquired optic nerve and peripapillary pits in highly myopic eyes.4 This has obvious implications for the accuracy of the normative database used during a patient’s assessment. High myopia is underrepresented in the population of most normative databases, and Asian ancestry may be as well. However, recent evidence suggests a dramatic increase in myopia in several Asian countries.5 In turn, myopia is a significant risk factor for glaucoma: in one study, moderate to high myopia was associated with a 2.6 odds ratio for glaucoma, and in the Korea National Health and Nutrition Examination Survey, the odds ratio for glaucoma in moderate myopia was 2.2 and for severe myopia it was 4.6.6,7
Serial imaging in the same patient is helpful in overcoming this issue. Over time, images can be compared to baseline to judge glaucomatous progression, especially when combined with other parameters of the evaluation. In this sense, each patient becomes his or her own normative database, with one important caveat: RNFL thickness decreases with age even in healthy, normal eyes. Thus, any change in RNFL thickness should be evaluated in this context. As well, it is important that serial imaging be registered to the same anatomic location. On the DRI OCT Triton, SMARTTrack capabilities ensure reproducibility of imaging over the same location during follow-up scans.
Overall, special care should be taken when performing OCT imaging in eyes with myopia, as the superotemporal and inferotemporal RNFL bundles may shift temporally, thereby giving the appearance of pseudo RNFL defects, specifically a temporal shift of the superior and inferior RNFL bundle peaks that may be misinterpreted as thinning—especially in comparison to a normative database that underrepresents myopia. Such false positives, termed red disease, occur in between 26 and 31% of myopic eyes on the SD-OCT RNFL thickness map. They typically appear in the superior and inferior region of the optic disc, and are more common in eyes with longer axial length and/or smaller disc area.8,9 The false positive rate on SD-OCT ganglion cell-inner plexiform layer maps is slightly higher at about 40% and is more common in eyes with longer axial length and a larger fovea-disc area.9
In addition to false-positive results, SD-OCT technology may, in some cases, produce images that indicate a false negative. There are at least two limitations with SD-OCT in this regard. First, SD-OCT technology employs a spectrometer to detect returning wavelengths of light; by comparison, SS-OCT uses a point photodetector, which is considered a simpler reconstruction mechanism, thus allowing faster scan speeds. It is not the case that SD-OCT is necessarily inferior technology, but rather that the greater scan speed of SS-OCT has implications both for reducing the signal-to-noise ratio, as well as for depicting relevant pathology. The second potential source of false-negative findings with SD-OCT relates to the size of the scanning area: the faster scan speed with reduced degradation with SS-OCT permits a wider scan area, which may assist in detecting pathology beyond the peripapillary and/or macular areas.
Conclusion
The move from time-domain to SD-OCT technology represented an incremental improvement in imaging capabilities, with attendant implications for the ability to accurately detect glaucoma. SS-OCT is poised to make a similar impact. In addition to the specific examples noted above, the DRI OCT Triton offers the clinician access to various other imaging modalities, including angiography (OCTA).* Ongoing research is investigating a potential role for OCTA in evaluating glaucoma. Currently, there is not a definitive role for OCTA in diagnosing glaucoma, but it may provide additional information in support of glaucoma evaluation.
What is becoming apparent, however, is that differences in how SS-OCT and SD-OCT perform segmentation and measurements have definite implications for the ability to diagnose pathology. For instance, the faster scan speed, wider scan area, and higher penetration available on SS-OCT allows for a more accurate depiction of RNFL defects, especially in myopic glaucoma. As well, SS-OCT is more sensitive for depicting RNFL defects compared to SD-OCT. Finally, the wider scan range of SS-OCT has an advantage in detecting RNFL defects that may have been missed in the conventional SD-OCT scan range.
1. Balasubramanian M, Bowd C, Vizzeri G, et al. Effect of image quality on tissue thickness measurements with spectral-domain optical coherence tomography. Opt Express. 2009;17:4019-4036.
2. Mansberger SL, Menda SA, Fortune BA, et al. Automated segmentation errors when using optical coherence tomography to measure retinal nerve fiber layer thickness in glaucoma. Am J Ophthalmol. 2017;174:1-8.
3. Mwanza JC, Bhorade AM, Sekhon N, et al. Effect of cataract and its removal on signal strength and peripapillary retinal nerve fiber layer optical coherence tomography measurements. J Glaucoma. 201;20(1):37-43.
4. Ohno-Matsui K, Akiba M, Moriyama M, et al. Acquired optic nerve and peripapillary pits in pathologic myopia. Ophthalmology. 2012;119(8):1685-1692.
5. Morgan IG, French AN, Ashby RS, et al. The epidemics of myopia: Aetiology and prevention. Prog Retin Eye Res. 2018;62:134-149.
6. Suzuki Y, Iwase A, Araie M, et al; Tajimi Study Group. Risk factors for open-angle glaucoma in a Japanese population: the Tajimi Study. Ophthalmology. 2006;113(9):1613-1617.
7. Shim SH, Sung KR, Kim JM, et al; Korean Ophthalmological Society. The prevalence of open-angle glaucoma by age in myopia: The Korea National Health and Nutrition Examination Survey. Curr Eye Res. 2017;42(1):65-71.
8. Kim NR, Lim H, Kim JH, et al. Factors associated with false positives in retinal nerve fiber layer color codes from spectral-domain optical coherence tomography. Ophthalmology. 2011;118(9):1774-1781.
9. Kim KE, Jeoung JW, Park KH, et al. Diagnostic classification of macular ganglion cell and retinal nerve fiber layer analysis: differentiation of false-positives from glaucoma. Ophthalmology. 2015 ;122(3):502-510.

